MiroFish: Deploy a Swarm of AI Agents to Build Knowledge Graphs and Predict the Future
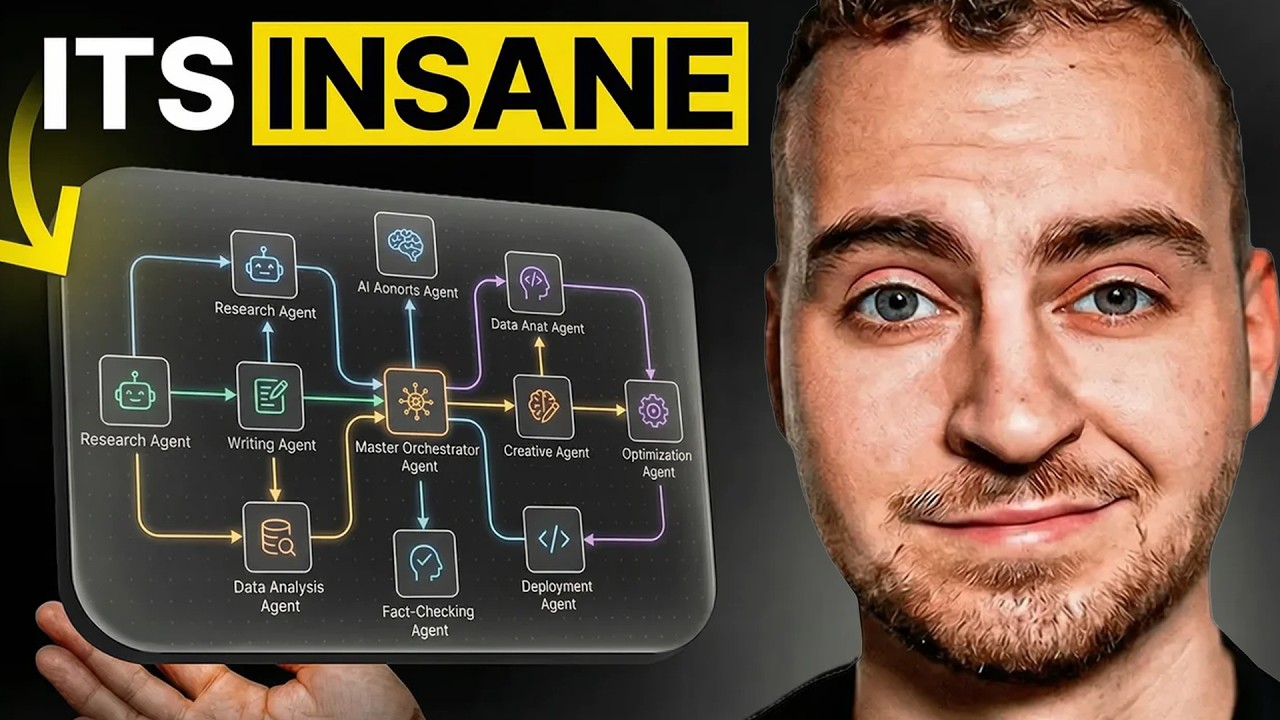
Tech With Tim explores MiroFish (MyrroFish), a project that deploys hundreds of AI agents in a swarm intelligence pattern across hundreds of runs, then synthesizes their outputs into a visual knowledge graph for complex prediction tasks. The demo — forecasting Dubai real estate prices — reveals non-obvious correlations no single agent would surface alone.
"I Spawned 10,000 AI Agents to Predict the Future (MiroFish is Insane)" by Tech With Tim — Watch on YouTube →
Key Takeaways
- MiroFish runs hundreds of agents in parallel across hundreds of iterations, each exploring different reasoning paths through a prediction problem. The swarm isn't just redundancy — divergent agents force the system to surface edge cases hidden from any single-pass analysis.
- The output is a knowledge graph, not a single answer: a visual map of relationships, confidence levels, conflicting conclusions, and consensus points across the entire agent swarm. This is richer than any point estimate.
- Swarm intelligence emerges from disagreement: agents that reach conflicting conclusions are the most valuable signal. The system tracks where consensus breaks down to highlight the highest-uncertainty regions of the prediction.
- Dubai real estate demo: the knowledge graph revealed a non-obvious correlation between EXPO legacy infrastructure and price trajectories in specific districts — a finding that emerged from cross-agent comparison, not from any individual agent's analysis.
- Cost and hardware: running hundreds of API calls per simulation makes this expensive at cloud rates. Local models (Ollama) dramatically reduce cost but require 16GB+ VRAM for the model quality needed for coherent reasoning chains.
How MiroFish Works
The architecture is straightforward: a controller spawns N agents with the same question but different reasoning seeds (temperature, context framing, starting assumptions). Each agent runs independently through the problem, building its own reasoning chain. After all agents complete, a synthesis step aggregates their outputs into a knowledge graph — nodes are concepts, edges are relationships, and edge weights reflect cross-agent consensus strength.
The knowledge graph is interactive: zoom in on any node to see which agents contributed to it, what conclusions they reached, and where they diverged. High-divergence nodes are the most interesting — they represent the genuine uncertainties in the prediction, not just noise.
Tim runs the demo on sample data he provides, showing the full pipeline from data input to final graph output. The tool is open-source and can be run locally with an Ollama backend or against cloud APIs.
Related on OpenClawDatabase
- Hermes + OpenClaw Multi-Agent Setup — practical multi-agent architecture for production use
- OpenClaw + Hermes Workflows — four patterns for coordinating multiple agents
- OpenClaw Hub — multi-agent capabilities and configuration
What you can actually set up from this
Extracted from the video's own transcript — the specifics the original summary left out.
Reproducible steps
- What it actually does
An open-source system that runs a parallel digital world of autonomous agents simulating something like Reddit and Twitter, communicating with each other to forecast an outcome. You supply base information — a research report, trend data, news — and one question.
- The five stages
<strong>(1) Knowledge graph</strong> built from your source material, so retrieval is graph-based rather than a blind file search. <strong>(2) Environment setup</strong> — it generates autonomous agents with distinct personas, goals and tasks derived from your data. <strong>(3) Dual-platform simulation</strong> across two社 network models, where agents post, comment, like, dislike, repost and quote-reply. <strong>(4) Report generation</strong> by a specialised report agent. <strong>(5) Deep interaction</strong>, where you can talk to any individual agent afterwards to understand its reasoning.
- The demonstrated run
A ten-year real-estate price forecast for a specific city district, seeded with historical data and current news. <strong>32 interactive agents</strong> debating, writing and chatting, producing a full report you can then interrogate agent by agent.
- The stack underneath
The simulation engine is <strong>Oasis</strong> (also open source). Memory uses a hosted graph service — <strong>the only paid component, with a limited free tier</strong>. FastAPI and Vue.js for the application layer. Any OpenAI-SDK-compatible model works: Claude, OpenAI, MiniMax, whatever you have.
Gotchas
- <strong>Sponsored.</strong> The presenter partnered with a VPS host offering one-click deployment, and recommends a specific plan tier. The project is open source and self-hostable; the hosting is convenience, not requirement.
- He is candid that self-hosting is complicated and slow to set up — "you probably don't want to spend three hours messing with it" — which is the honest framing of why the sponsored shortcut appears.
- <strong>This forecasts by simulating opinion, not by modelling fundamentals.</strong> Cited real-world uses include a prediction-market trading bot and a fear-and-greed index. Treat outputs as structured scenario generation, not analysis — and note that the demo question is one the presenter has money riding on.
- Popularity figures quoted (stars, forks, trending position, build time) are repository metrics, not evidence the forecasts are any good.
More OpenClaw & Claude Code news
 A fully local agent with tools, in about 40 lines: Ollama plus Pydantic AI
 Running Nex-N2.5 Mini on two H100s: the SGLang container setup, and an honest benchmark read
 Semantic grep cut agent tool calls 58% and input tokens 47% in the project's own benchmarks
 The instruction ceiling moved 10x in a year: 200 rules became 2,000
 How LinkedIn made coding agents work on 1,000+ internal repos without fine-tuning
 Two context approaches that look right and stall: the curated-context trap and the MCP plateau
← Back to News digest · See also: OpenClaw guide